
Lake Travis Water Level Forecast (8/1/2021)
Lake Travis Water Level Forecast (as of 8/2/2021)
Data Source: Lower Colorado River Authority
This document is not intended for publication and is only a
personal record of a forecast made on 8/2/2021, for tracking purposes.
This original forecast is provided free of charge to
interested members of the general public as a courtesy. No warranty is made as
to the accuracy.
Historical
 |
Fig. 1: Lake Travis water level decomposed: Actual (top), Trend-Cycle (2nd), Seasonal (3rd), and Error (bottom) |
Forecast

Fig. 2: Lake Travis monthly mean water level 6-month forecast with confidence intervals
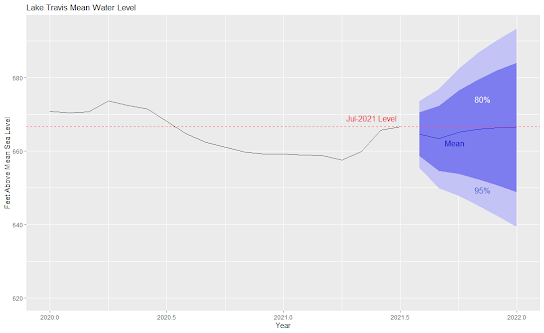
Fig. 3: Lake Travis monthly mean water level 1/2020 through 12/2021
|
| Fig. 2: Lake Travis monthly mean water level 6-month forecast with confidence intervals |
|
| Fig. 3: Lake Travis monthly mean water level 1/2020 through 12/2021 |
 |
| Fig. 4: Lake Travis monthly mean historical with forecast |
Forecast Data
|
|
Mean |
Lo.80 |
Hi.80 |
Lo.95 |
Hi.95 |
Actual |
Δ |
%Δ |
|
Aug-2021 |
664.5 |
658.6 |
670.5 |
655.4 |
673.6 |
666.1 |
-1.6 |
-0.24% |
|
Sep-2021 |
663.4 |
654.6 |
672.2 |
649.9 |
676.9 |
663.8 |
-0.4 |
-0.06% |
|
Oct-2021 |
665.1 |
653.8 |
676.5 |
647.9 |
682.4 |
663.1 |
2.0 |
0.3% |
Frequently Asked Questions
Q1: Why do I do these Lake Travis forecasts?
A1: I generate these forecast on a quarterly or semi-annual basis for the following reasons:
- I have an ongoing recreational interest in the
water level of Lake Travis.
- Public Service: My club (Austin Yacht Club) and
all Lake Travis boaters have a keen interest in knowing future water levels.
- I derive entertainment and educational value
from doing forecasts like this and seek other opportunities for similar challenges.
- I seek to re-channel my successful software engineering career toward a hybrid career that will merge my enjoyment of software engineering with my passion for econometric analysis and forecasting.
Q2: Doesn’t LCRA provide forecasts of Lake Travis water
levels?
A2: Yes, they do provide 6-month “projections” each month. They
also hold the keys to the dam. They have both control and fiduciary interest in
the data being forecast. I would encourage readers to compare my forecasts to
LCRA projections for accuracy. I would, however, caution the reader that LCRA
projections are for water levels for specific dates (the 1st of each
month?). In contrast, my forecasts are for a monthly average water level for
each month being forecast.
Q3: Can’t we just use Excel to forecast things like this?
A3: You can. And that may fit your particular need quite
well. Another method would be to print out a graph and draw a line through both
the same month in the first year of data and the last year of data and carry
that line forward. These methods might both suite your needs (no sarcasm). I
would encourage you to compare these forecasts against mine, those of LCRA, and
observed results. I think you will find that not all methods are equally
accurate over time.
Q4: So … you’ve studied Economics / Econometrics. How does
that qualify you to forecast a hydrological phenomenon like the water level of
a lake?
A4: The water level of Lake Travis is indeed a hydrological phenomenon. But it is also an economic phenomenon – it is impacted by statewide electrical demand, and the irrigation demands of farmers downstream. Forecasting the water level of Lake Travis is very much an econometric problem that involves some hydrology.
About the Author
I am currently enrolled in the MS Finance & Economics
program at West Texas Univ. I am an experienced Software Development Eng.,
formerly of 3M, Dell, and Microsoft. I am also a former Peace Corps Volunteer
and in a prior career, I was an Economist.
Comments
Post a Comment